Elasticsearch, Kibana for IoT Data Visualization and Analysis
Elasticsearch, Kibana for IoT Data Visualization and Analysis
Launch an Elasticsearch instance or run Elasticsearch on your own Linux
The first step is to have an account for Elastic Cloud. If you don’t have one, you can register for a trial here (no credit card required). Once you log in, you can create a new deployment, choosing the size of the Elasticsearch instances that you want to use.
Use Elasticsearch and Kibana in the cloud: Easiest way!
you can follow this link to create an instance using the free-trial service: https://www.elastic.co/docs/deploy-manage/deploy/elastic-cloud/create-an-elastic-cloud-hosted-deployment#ec-prepare-production
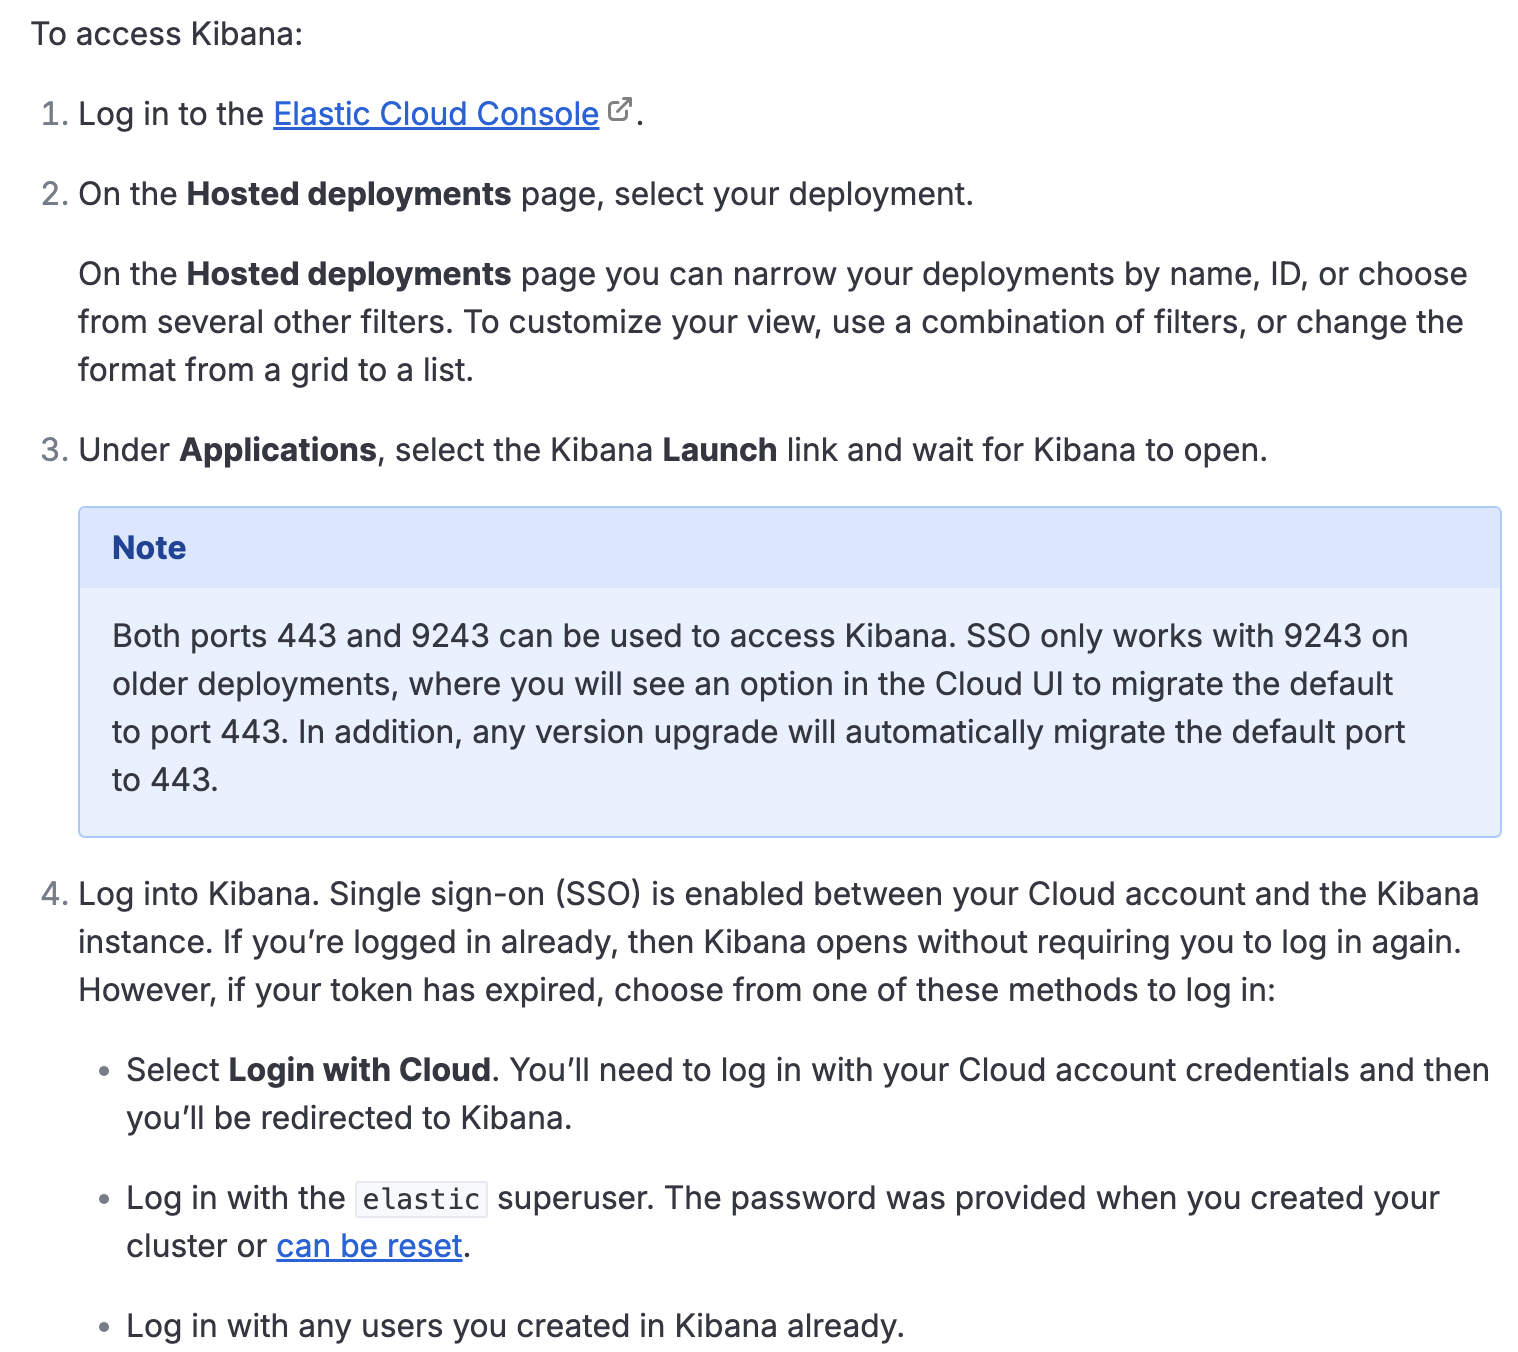
After launching Elasticsearch instance, you can access the Kibana on the Elastic Cloud Hosted: https://www.elastic.co/docs/deploy-manage/deploy/elastic-cloud/access-kibana
Install Elasticsearch and Kibana on your own (Hard unless you have Linux System)
If you have linux system which has installed Docker, you can use
You need to follow this link to install elasticsearch: https://www.elastic.co/docs/deploy-manage/deploy/self-managed/installing-elasticsearch
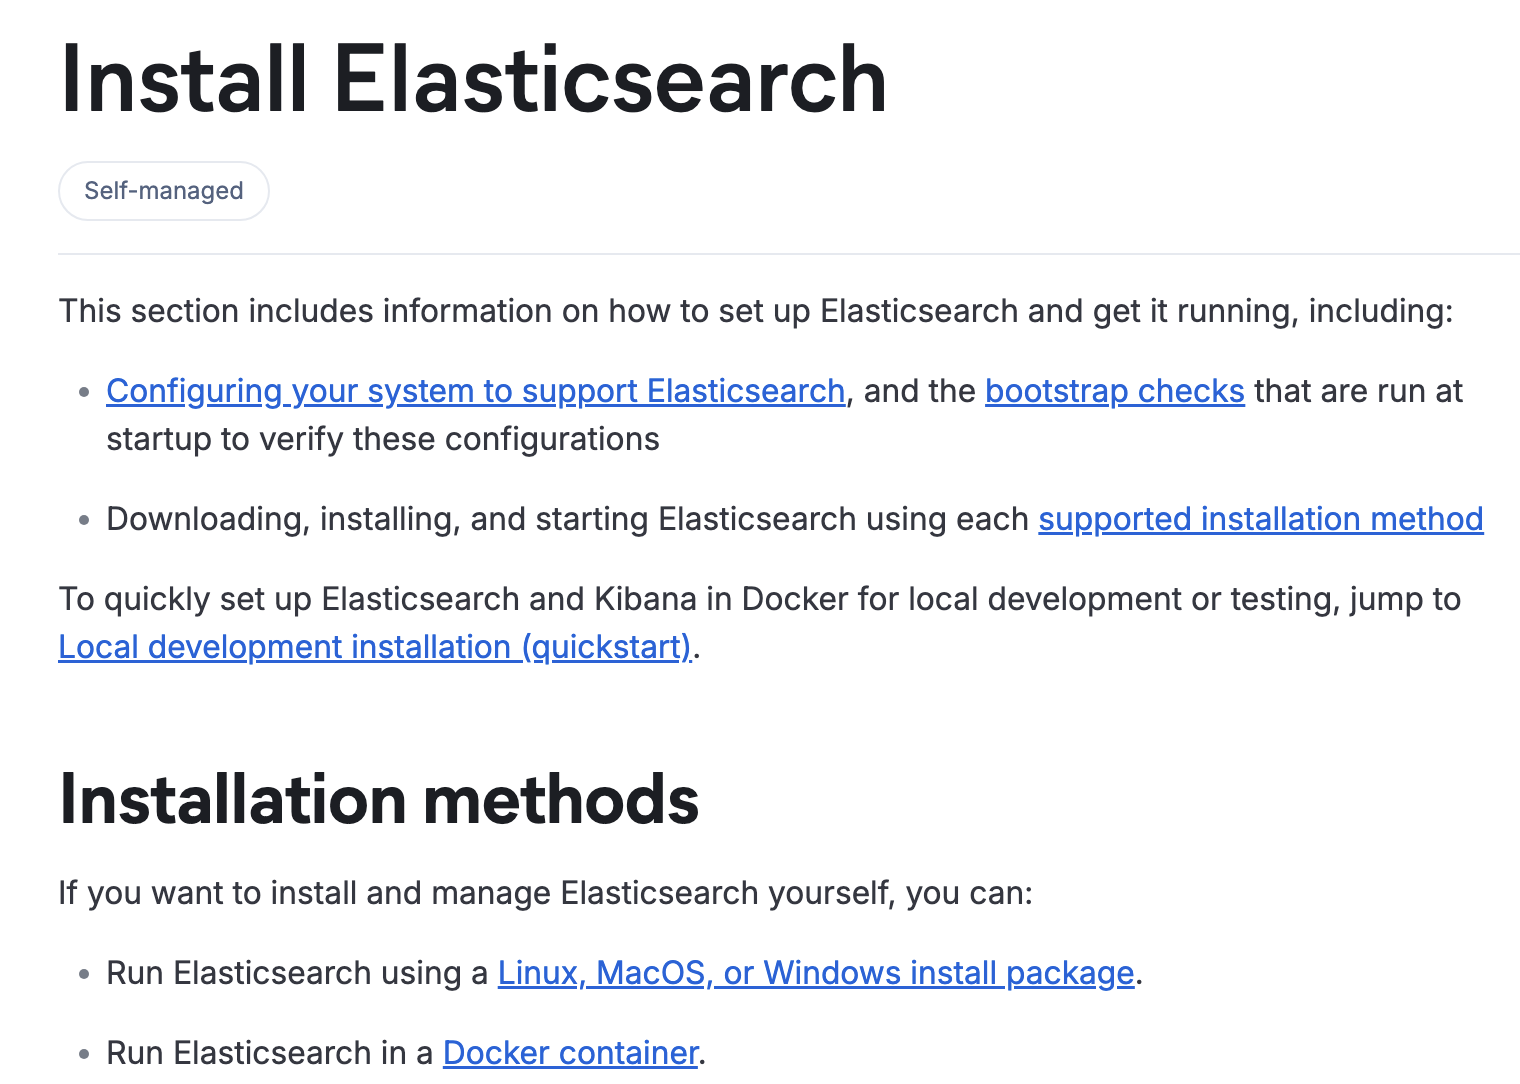
For installing Kibana, please follow this link: https://www.elastic.co/docs/deploy-manage/deploy/self-managed/install-kibana
Install Elasticsearch and Kibana using Docker in Linux system (the quickest one)
Install Docker Compose:
1
sudo apt remove $(dpkg --get-selections docker.io docker-compose docker-compose-v2 docker-doc podman-docker containerd runc | cut -f1)
```
Add Docker’s official GPG key:
sudo apt update
sudo apt install ca-certificates curl
sudo install -m 0755 -d /etc/apt/keyrings
sudo curl -fsSL https://download.docker.com/linux/ubuntu/gpg -o /etc/apt/keyrings/docker.asc
sudo chmod a+r /etc/apt/keyrings/docker.ascAdd the repository to Apt sources:
sudo tee /etc/apt/sources.list.d/docker.sources <<EOF
Types: deb
URIs: https://download.docker.com/linux/ubuntu
Suites: $(. /etc/os-release && echo “${UBUNTU_CODENAME:-$VERSION_CODENAME}”)
Components: stable
Signed-By: /etc/apt/keyrings/docker.asc
EOFsudo apt update
1
2
3
4
5
6
7
Type the two commands one-by-one into the terminal, then docker will be installed and running

3. Execute
curl -fsSL https://elastic.co/start-local | sh
1
2
3
4
5
6
7
8
9
10
11
12
13
14
15
16
17
18
19
Then Elasticsearch and Kibana will run!
🎉 Congrats, Elasticsearch and Kibana are installed and running in Docker!
🌐 Open your browser at http://localhost:5601
Username: elastic
Password: UARgnTER
🔌 Elasticsearch API endpoint: http://localhost:9200
🔑 API key: QlZIMXVKd0JCcFJnTzJVTW1qNVg6aDBTNVlSRVJEcFVLY3RFa3dxcnpYUQ==
## IoT simulation and data visualization
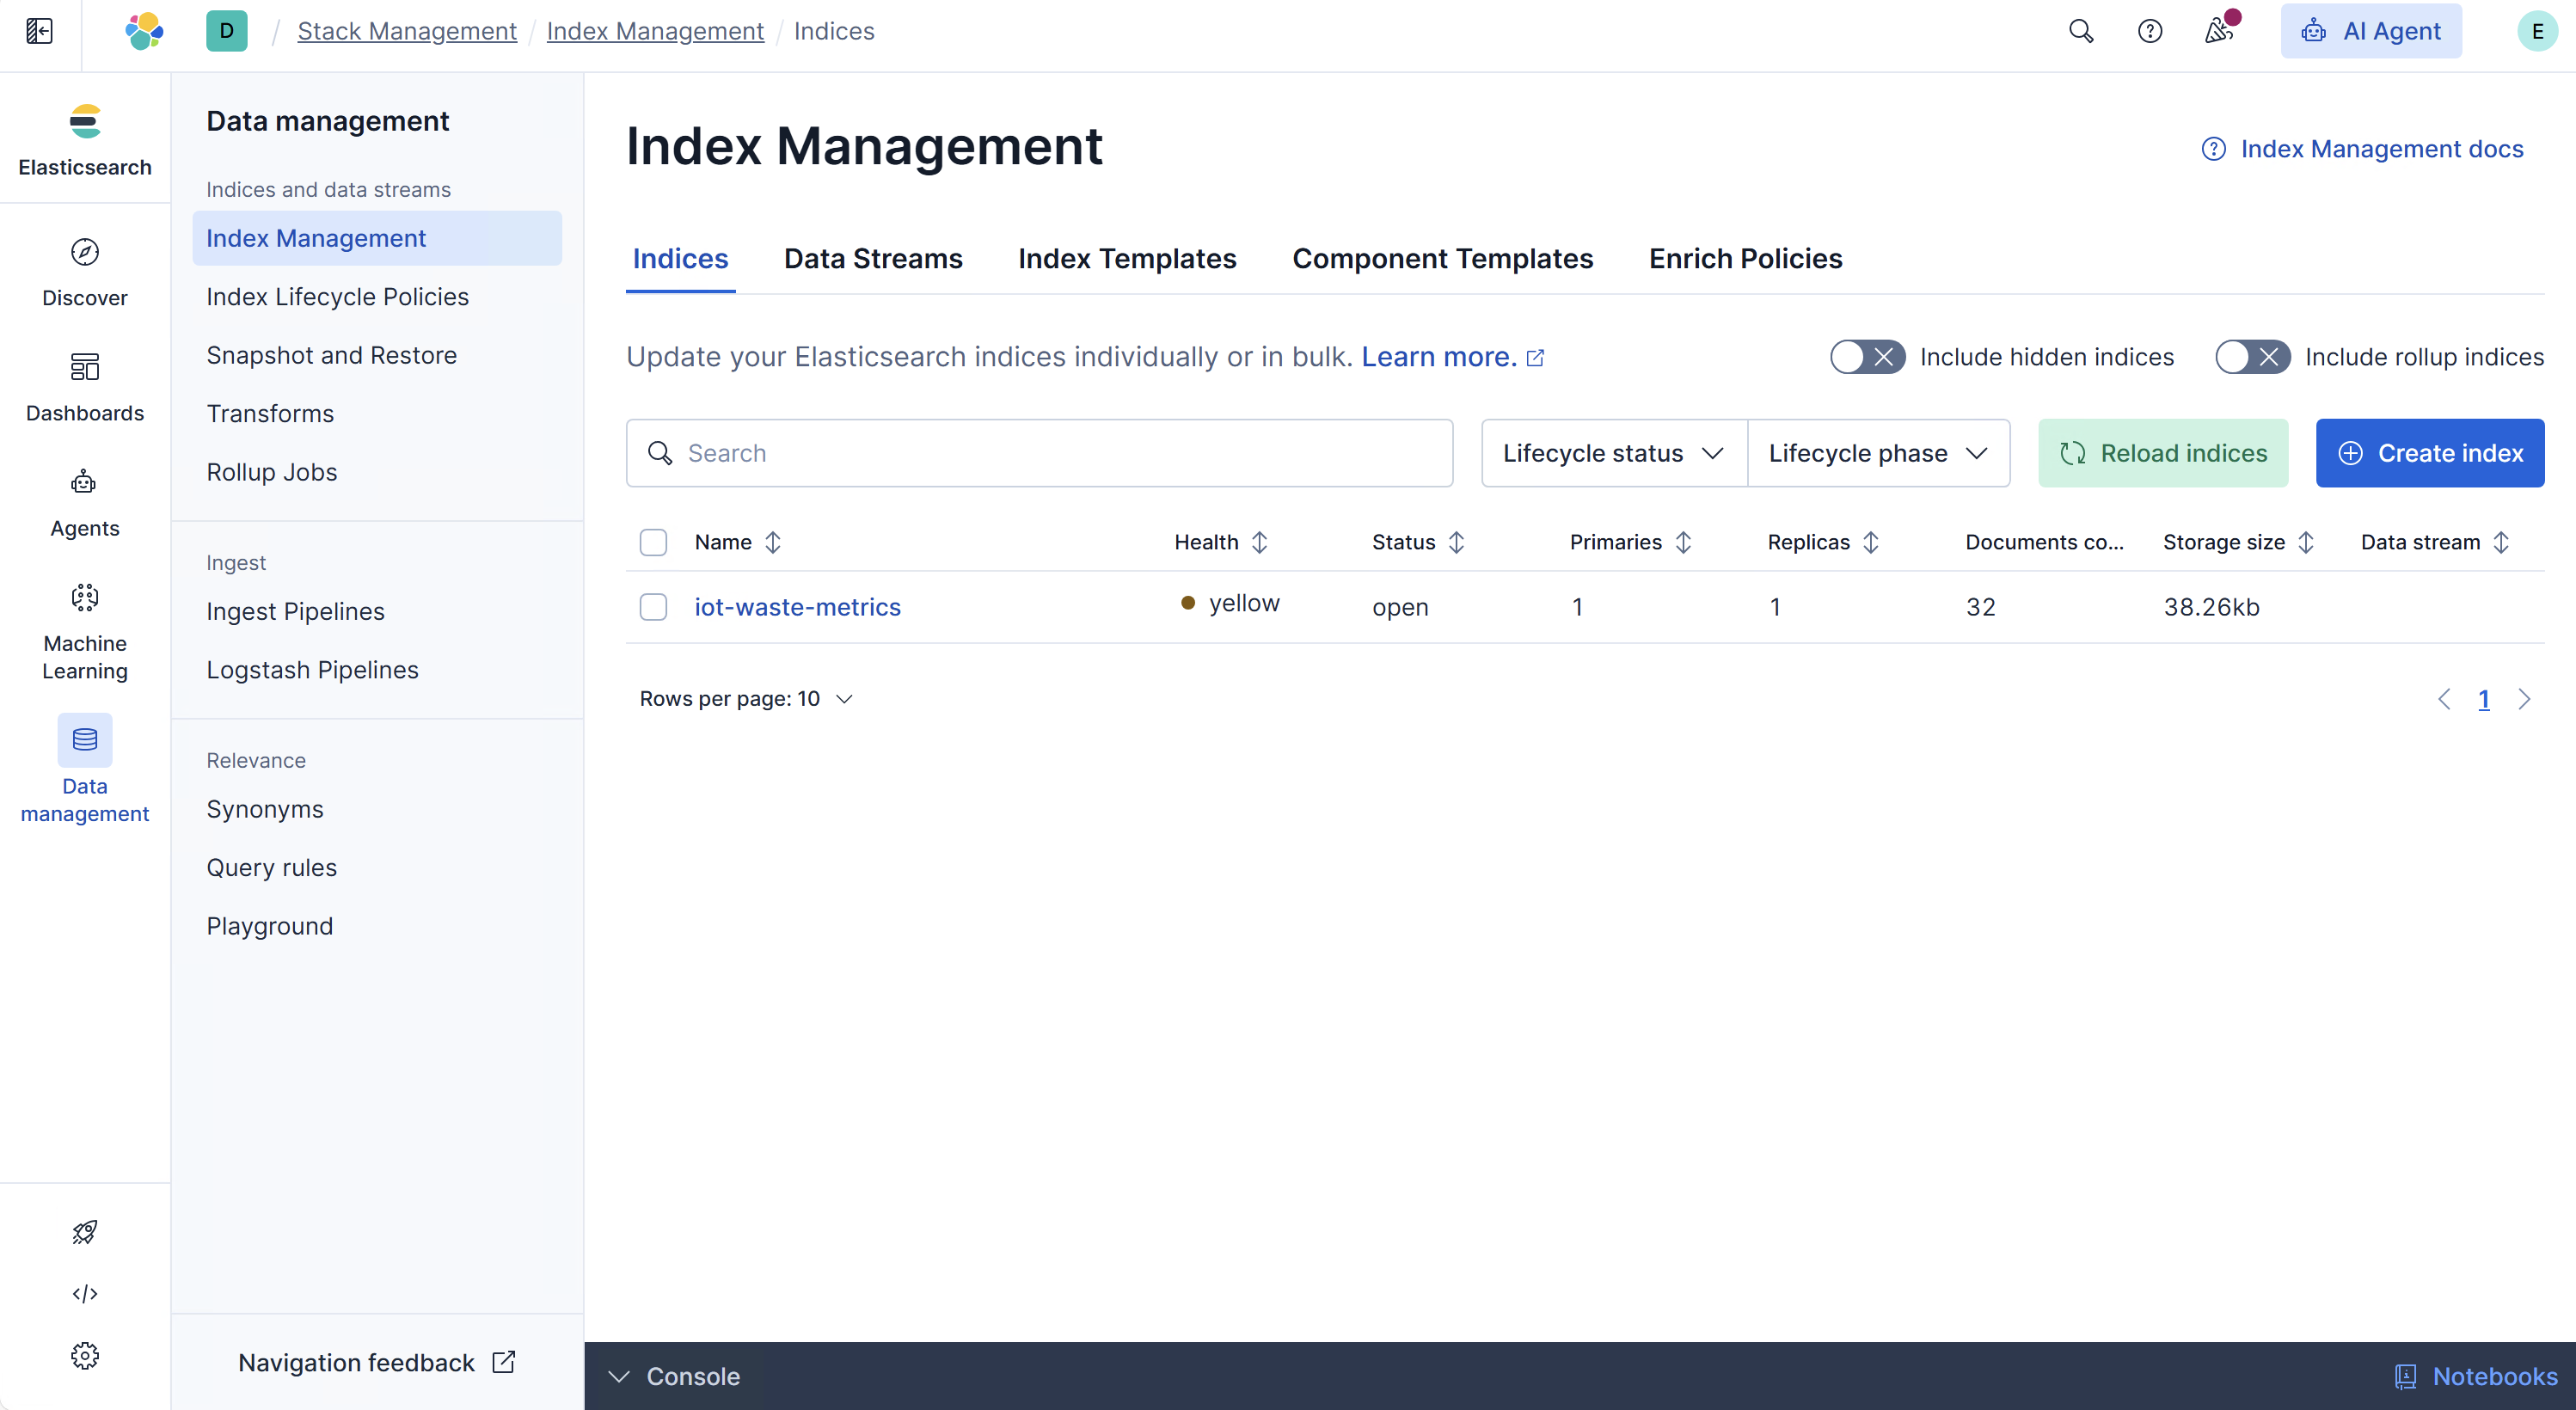
Now you can access http://localhost:5601 to see the dashboard of Elasticsearch.
Now we use python to simulate IoT data, first we install `elasticsearch` library.pip install elasticsearch
1
2
3
4
5
6
7
8
9
10
11
12
13
14
15
16
17
18
19
20
21
22
23
24
25
26
27
28
29
30
31
32
33
34
35
36
37
38
39
40
41
42
43
44
45
46
47
48
49
50
51
52
53
54
55
We write a python script:

```python
from elasticsearch import Elasticsearch
import time
import random
from datetime import datetime, timezone

# 1. Initialize the Elasticsearch connection
# If you are running this script locally with SSH port forwarding, you can connect directly to localhost:9200.
# If you are running this script on the server, you also connect to localhost:9200.
ELASTIC_PASSWORD = "Replace_with_the_password_found_in_the_.env_file"

es = Elasticsearch(
    "http://localhost:9200",
    basic_auth=("elastic", ELASTIC_PASSWORD)
)

# Verify if the connection is successful
if es.ping():
    print("✅ Successfully connected to Elasticsearch!")
else:
    print("❌ Connection failed. Please check the service status and password.")
    exit()

# 2. Simulate the IoT data source and send it in real-time
index_name = "iot-waste-metrics"

print("🚀 Starting to send simulated IoT data... (Press Ctrl+C to stop)")
try:
    while True:
        # Simulate 5 different smart waste bin devices
        device_id = f"smart-bin-{random.randint(1, 5)}"

        # Build the sensor payload
        doc = {
            "@timestamp": datetime.now(timezone.utc).isoformat(),
            "device_id": device_id,
            "fill_level_pct": round(random.uniform(10.0, 95.0), 2),  # Fill level 10% - 95%
            "temperature_c": round(random.uniform(15.0, 35.0), 1),   # Internal temperature
            "moisture_level": round(random.uniform(20.0, 80.0), 1),  # Moisture level
            "status": "active" if random.random() > 0.05 else "maintenance"
        }

        # Write the data to Elasticsearch
        response = es.index(index=index_name, document=doc)

        print(f"[{doc['@timestamp']}] Data sent | Device: {device_id} | Fill Level: {doc['fill_level_pct']}% | Temperature: {doc['temperature_c']}°C")

        # Send data once every 2 seconds
        time.sleep(2)

except KeyboardInterrupt:
    print("\n🛑 Stopped sending data.")
Then we fill in the ELASTIC_PASSWORD and run it.
Here we can see a lot of data in the Elasticsearch Dashboard:
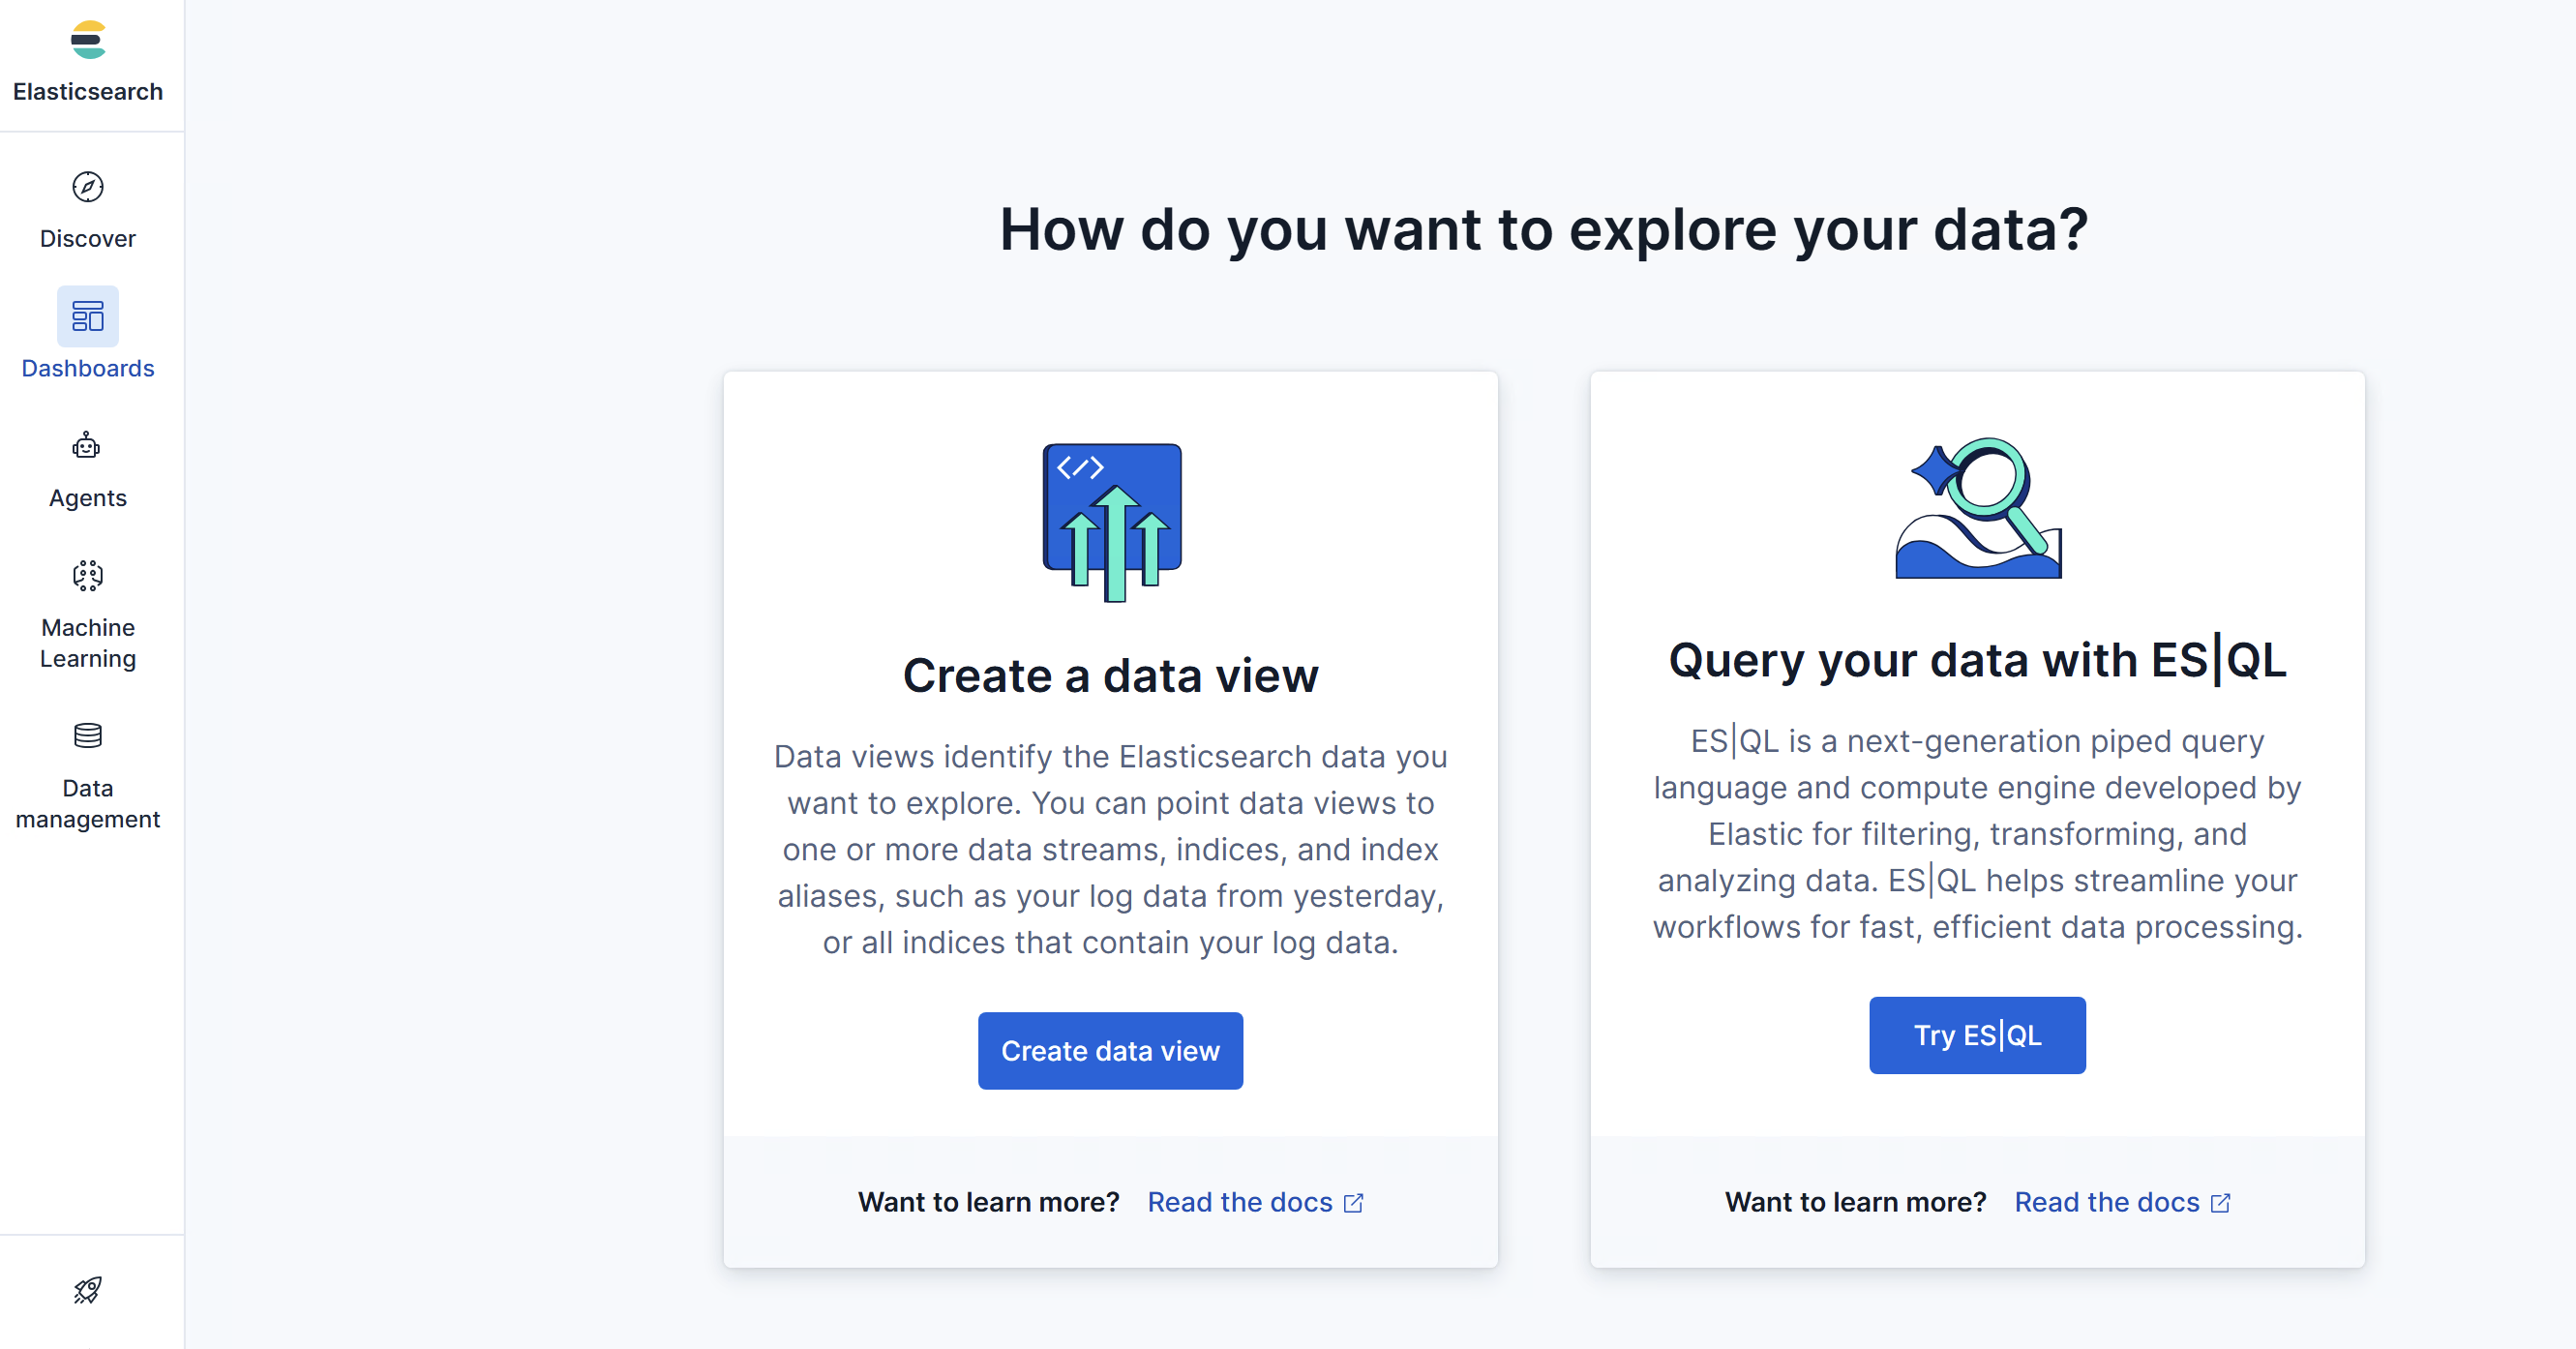
Then we click Dashboards, to create a data view:
When creating a data view, we fill in Index Pattern with iot-waste-metrics we used in the Python script.
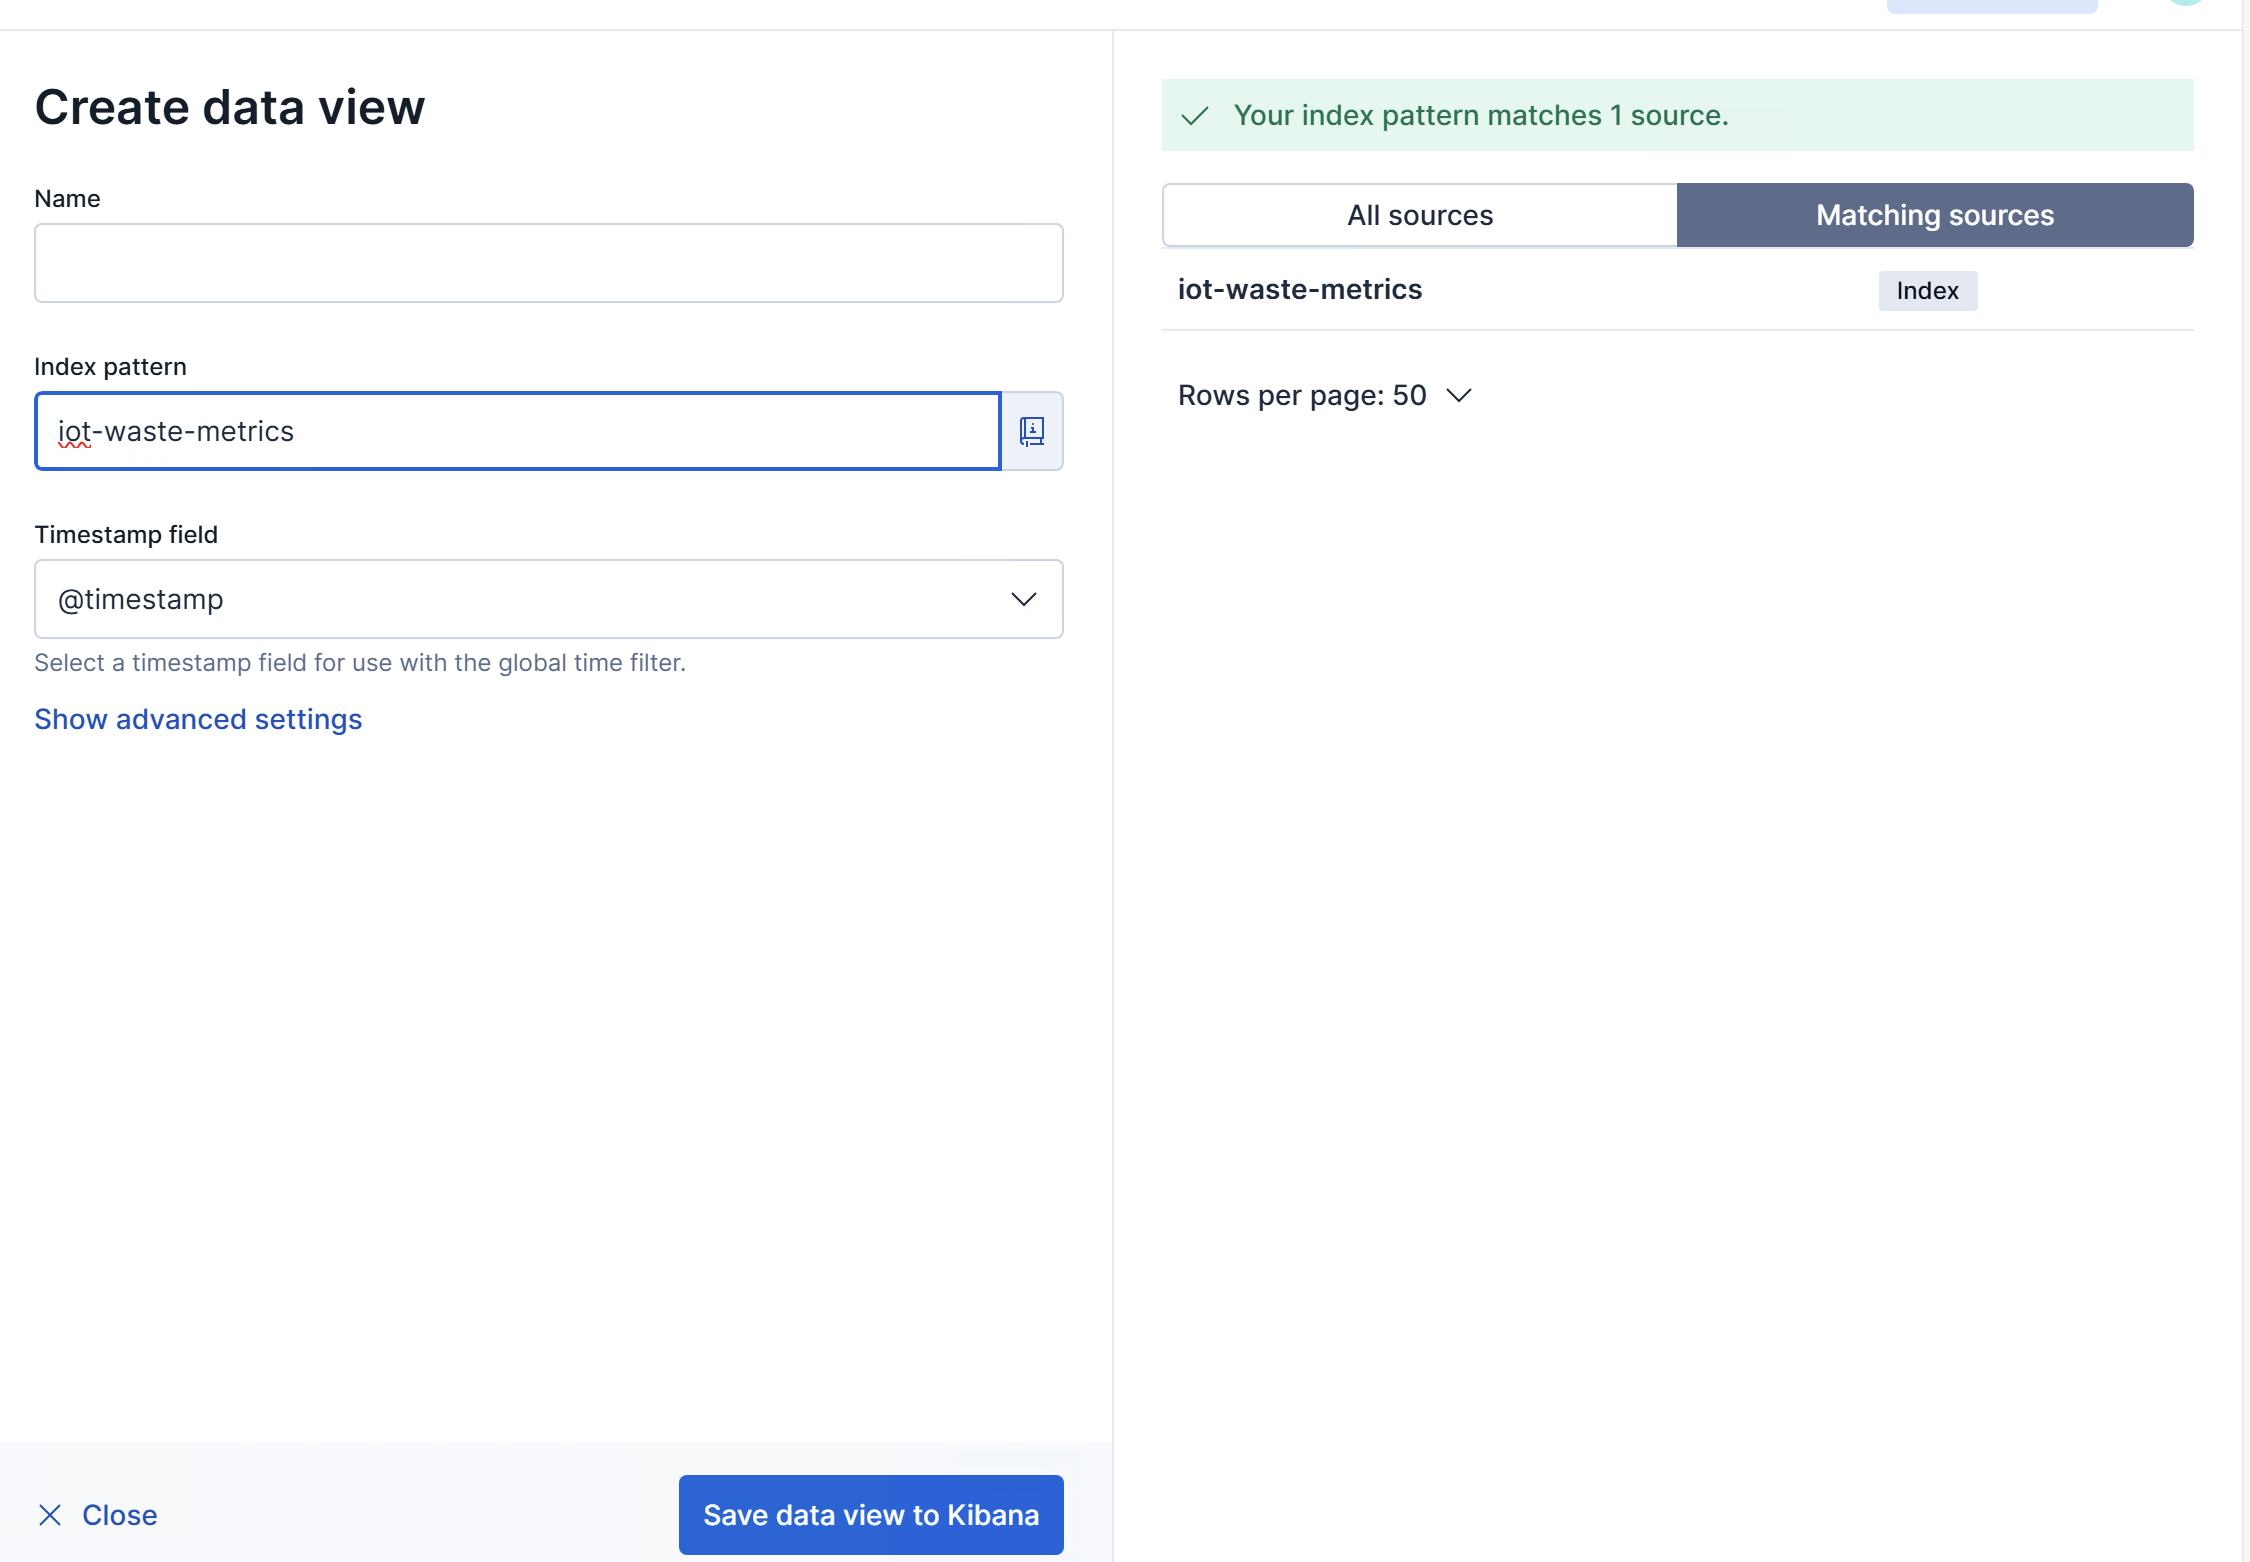
We save data view to Kibana.
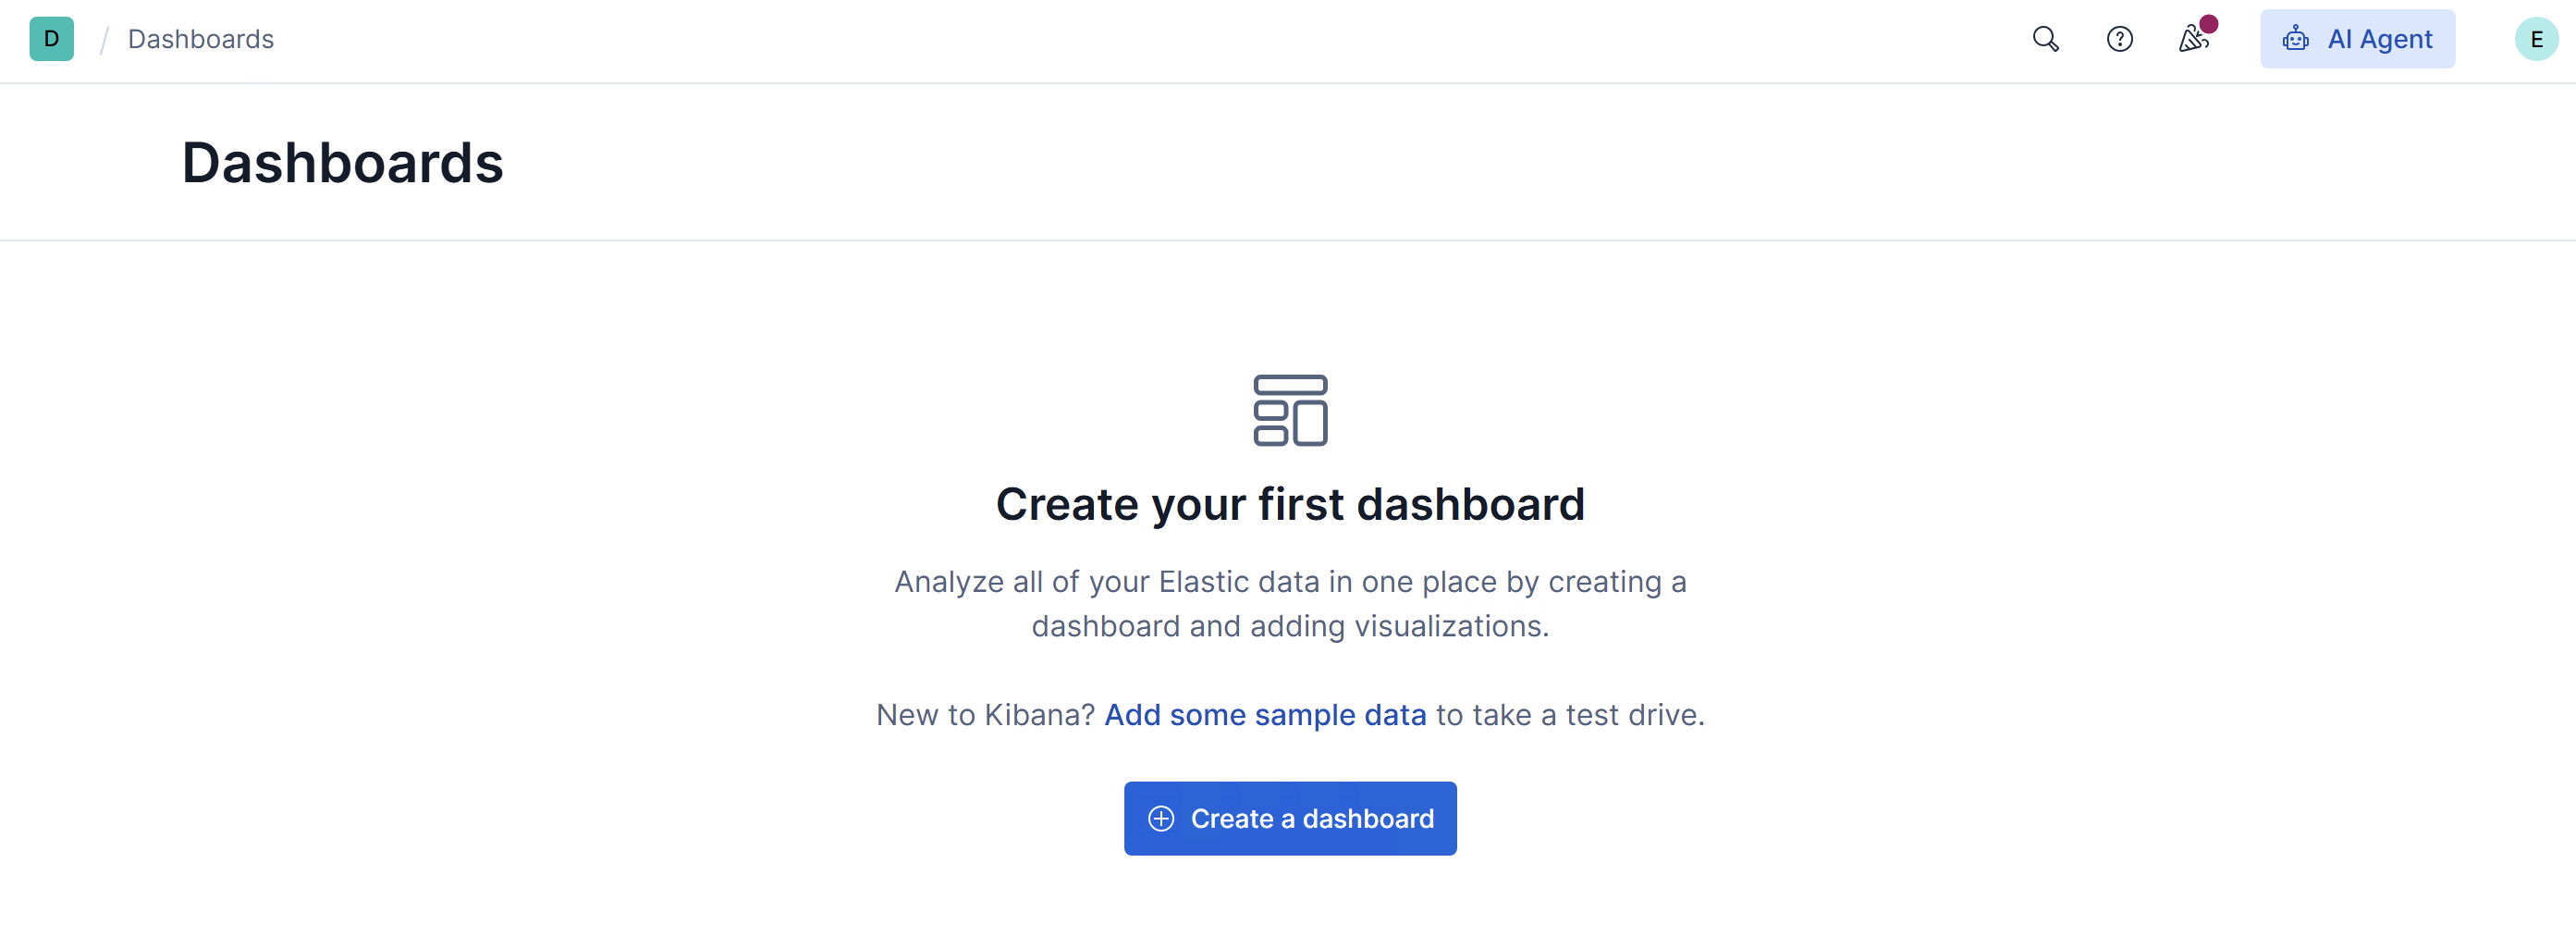
Then we create a dashboard, as shown in Figure below:
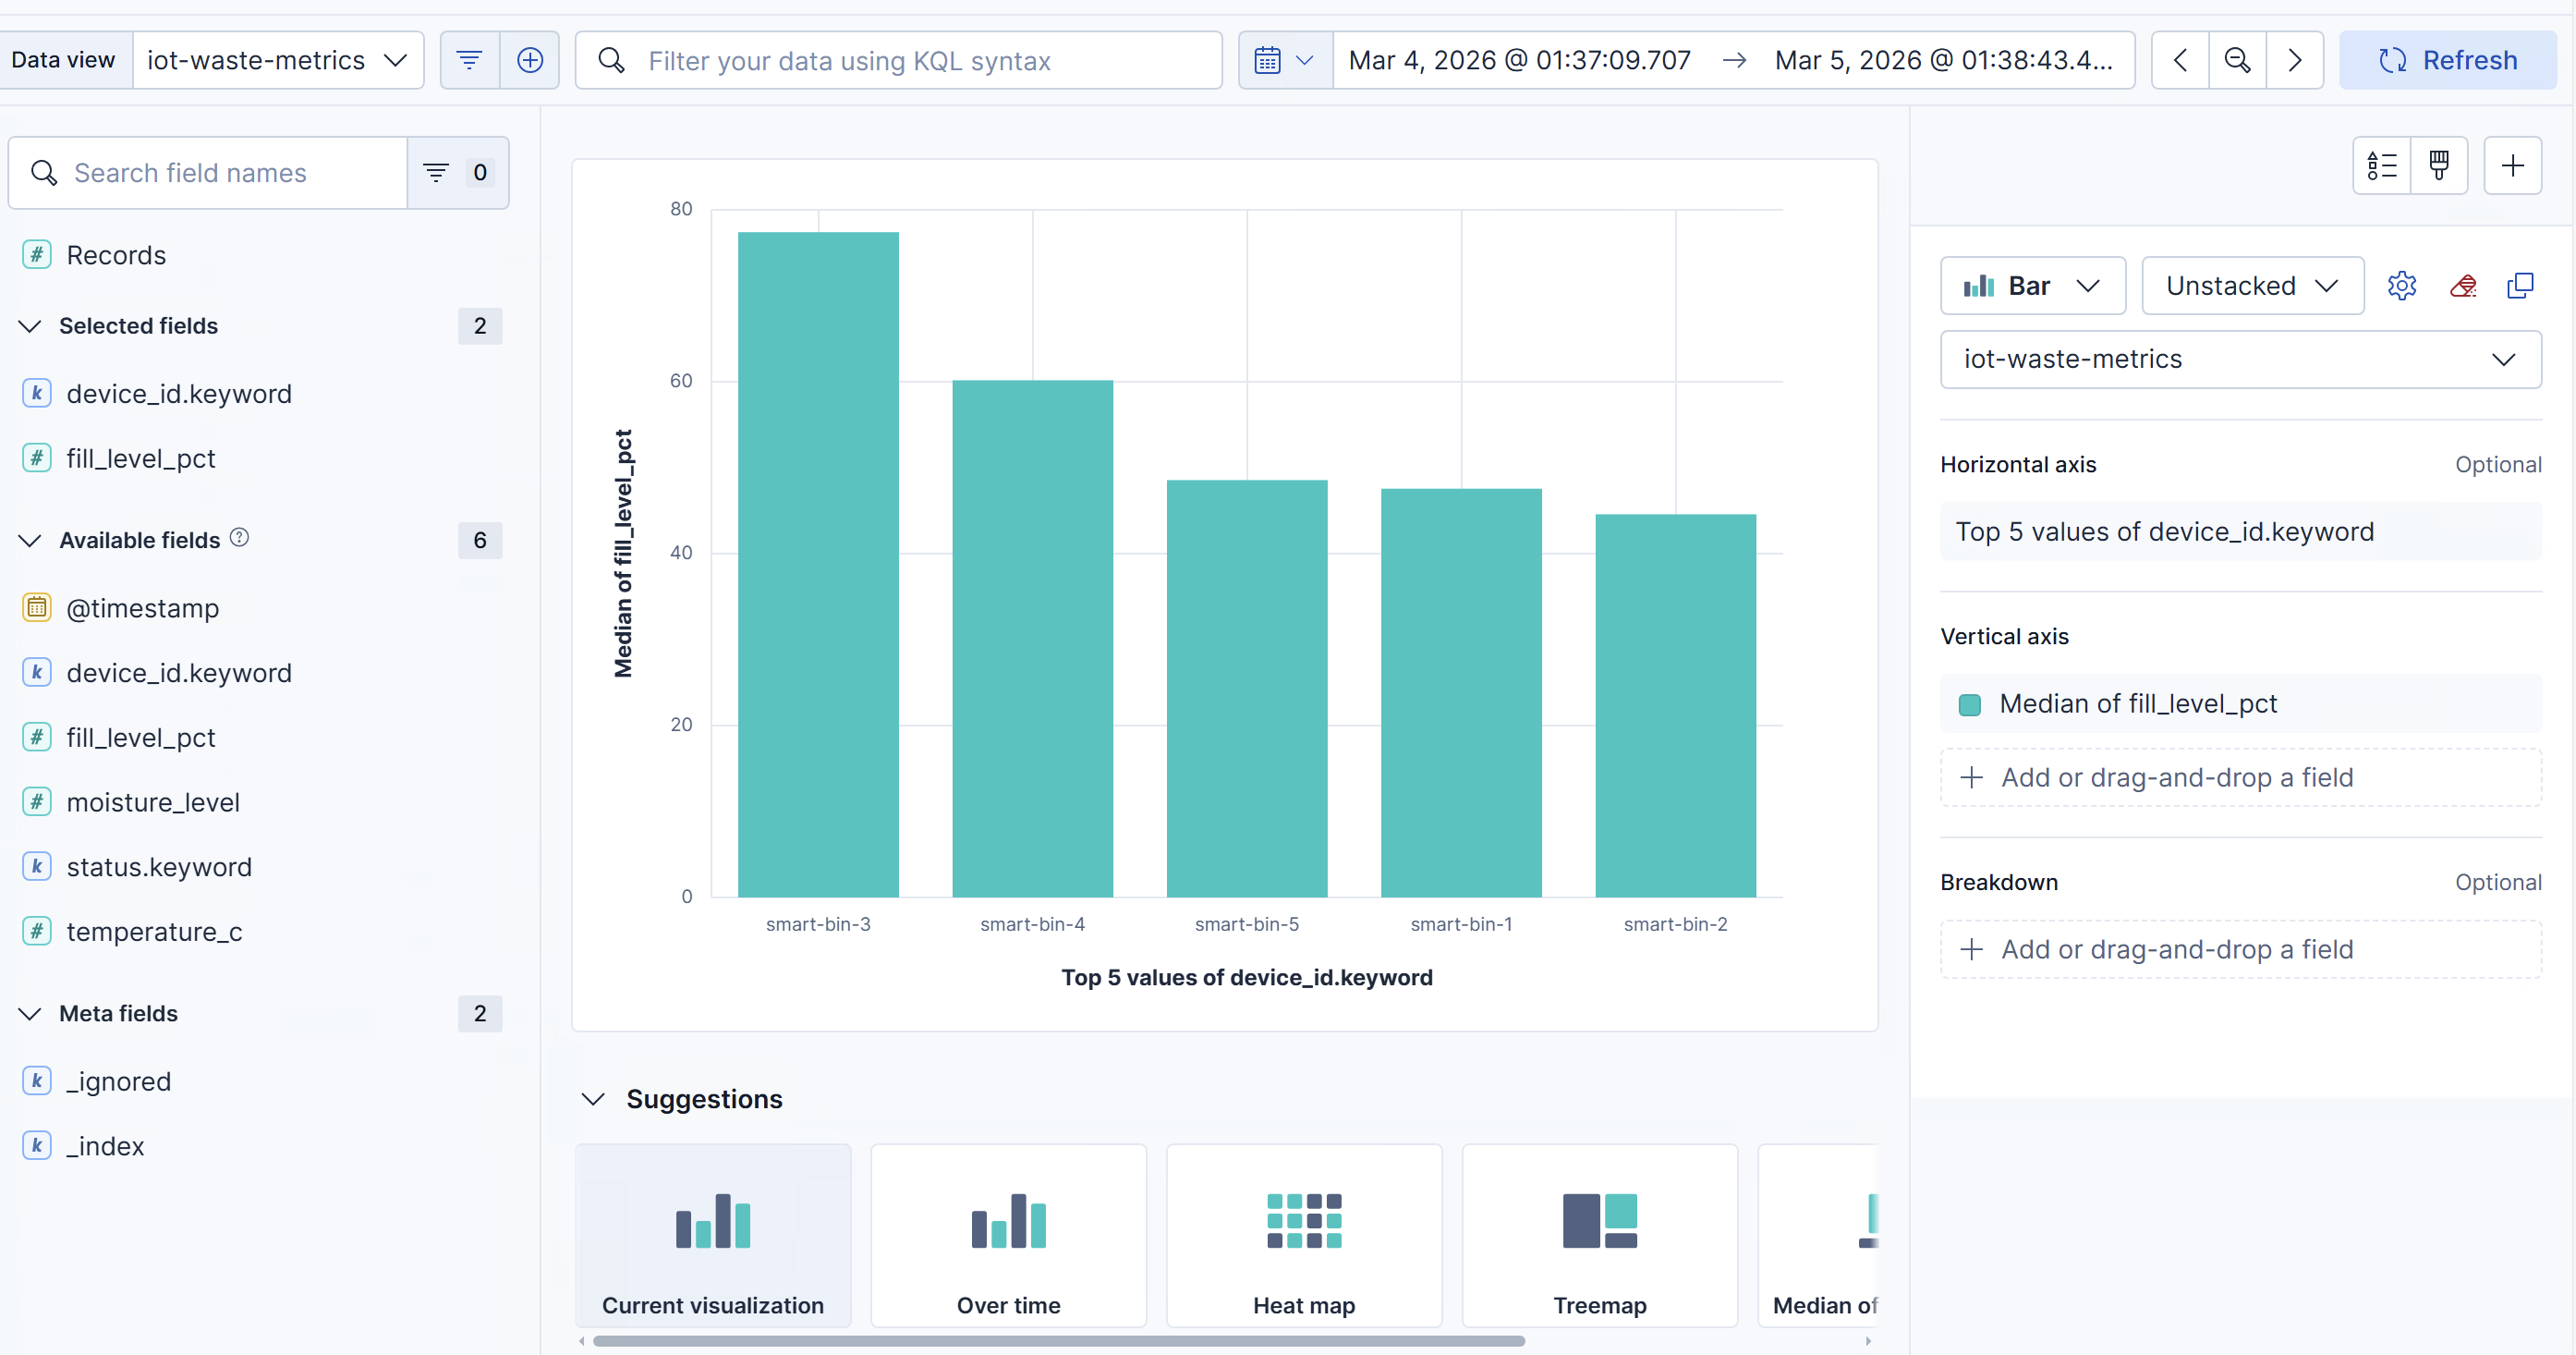
We create a dashboard and then create a visualization. After that, as shown in Figure below, we can drag fill_level_pct into the center of the canva, to create a view.
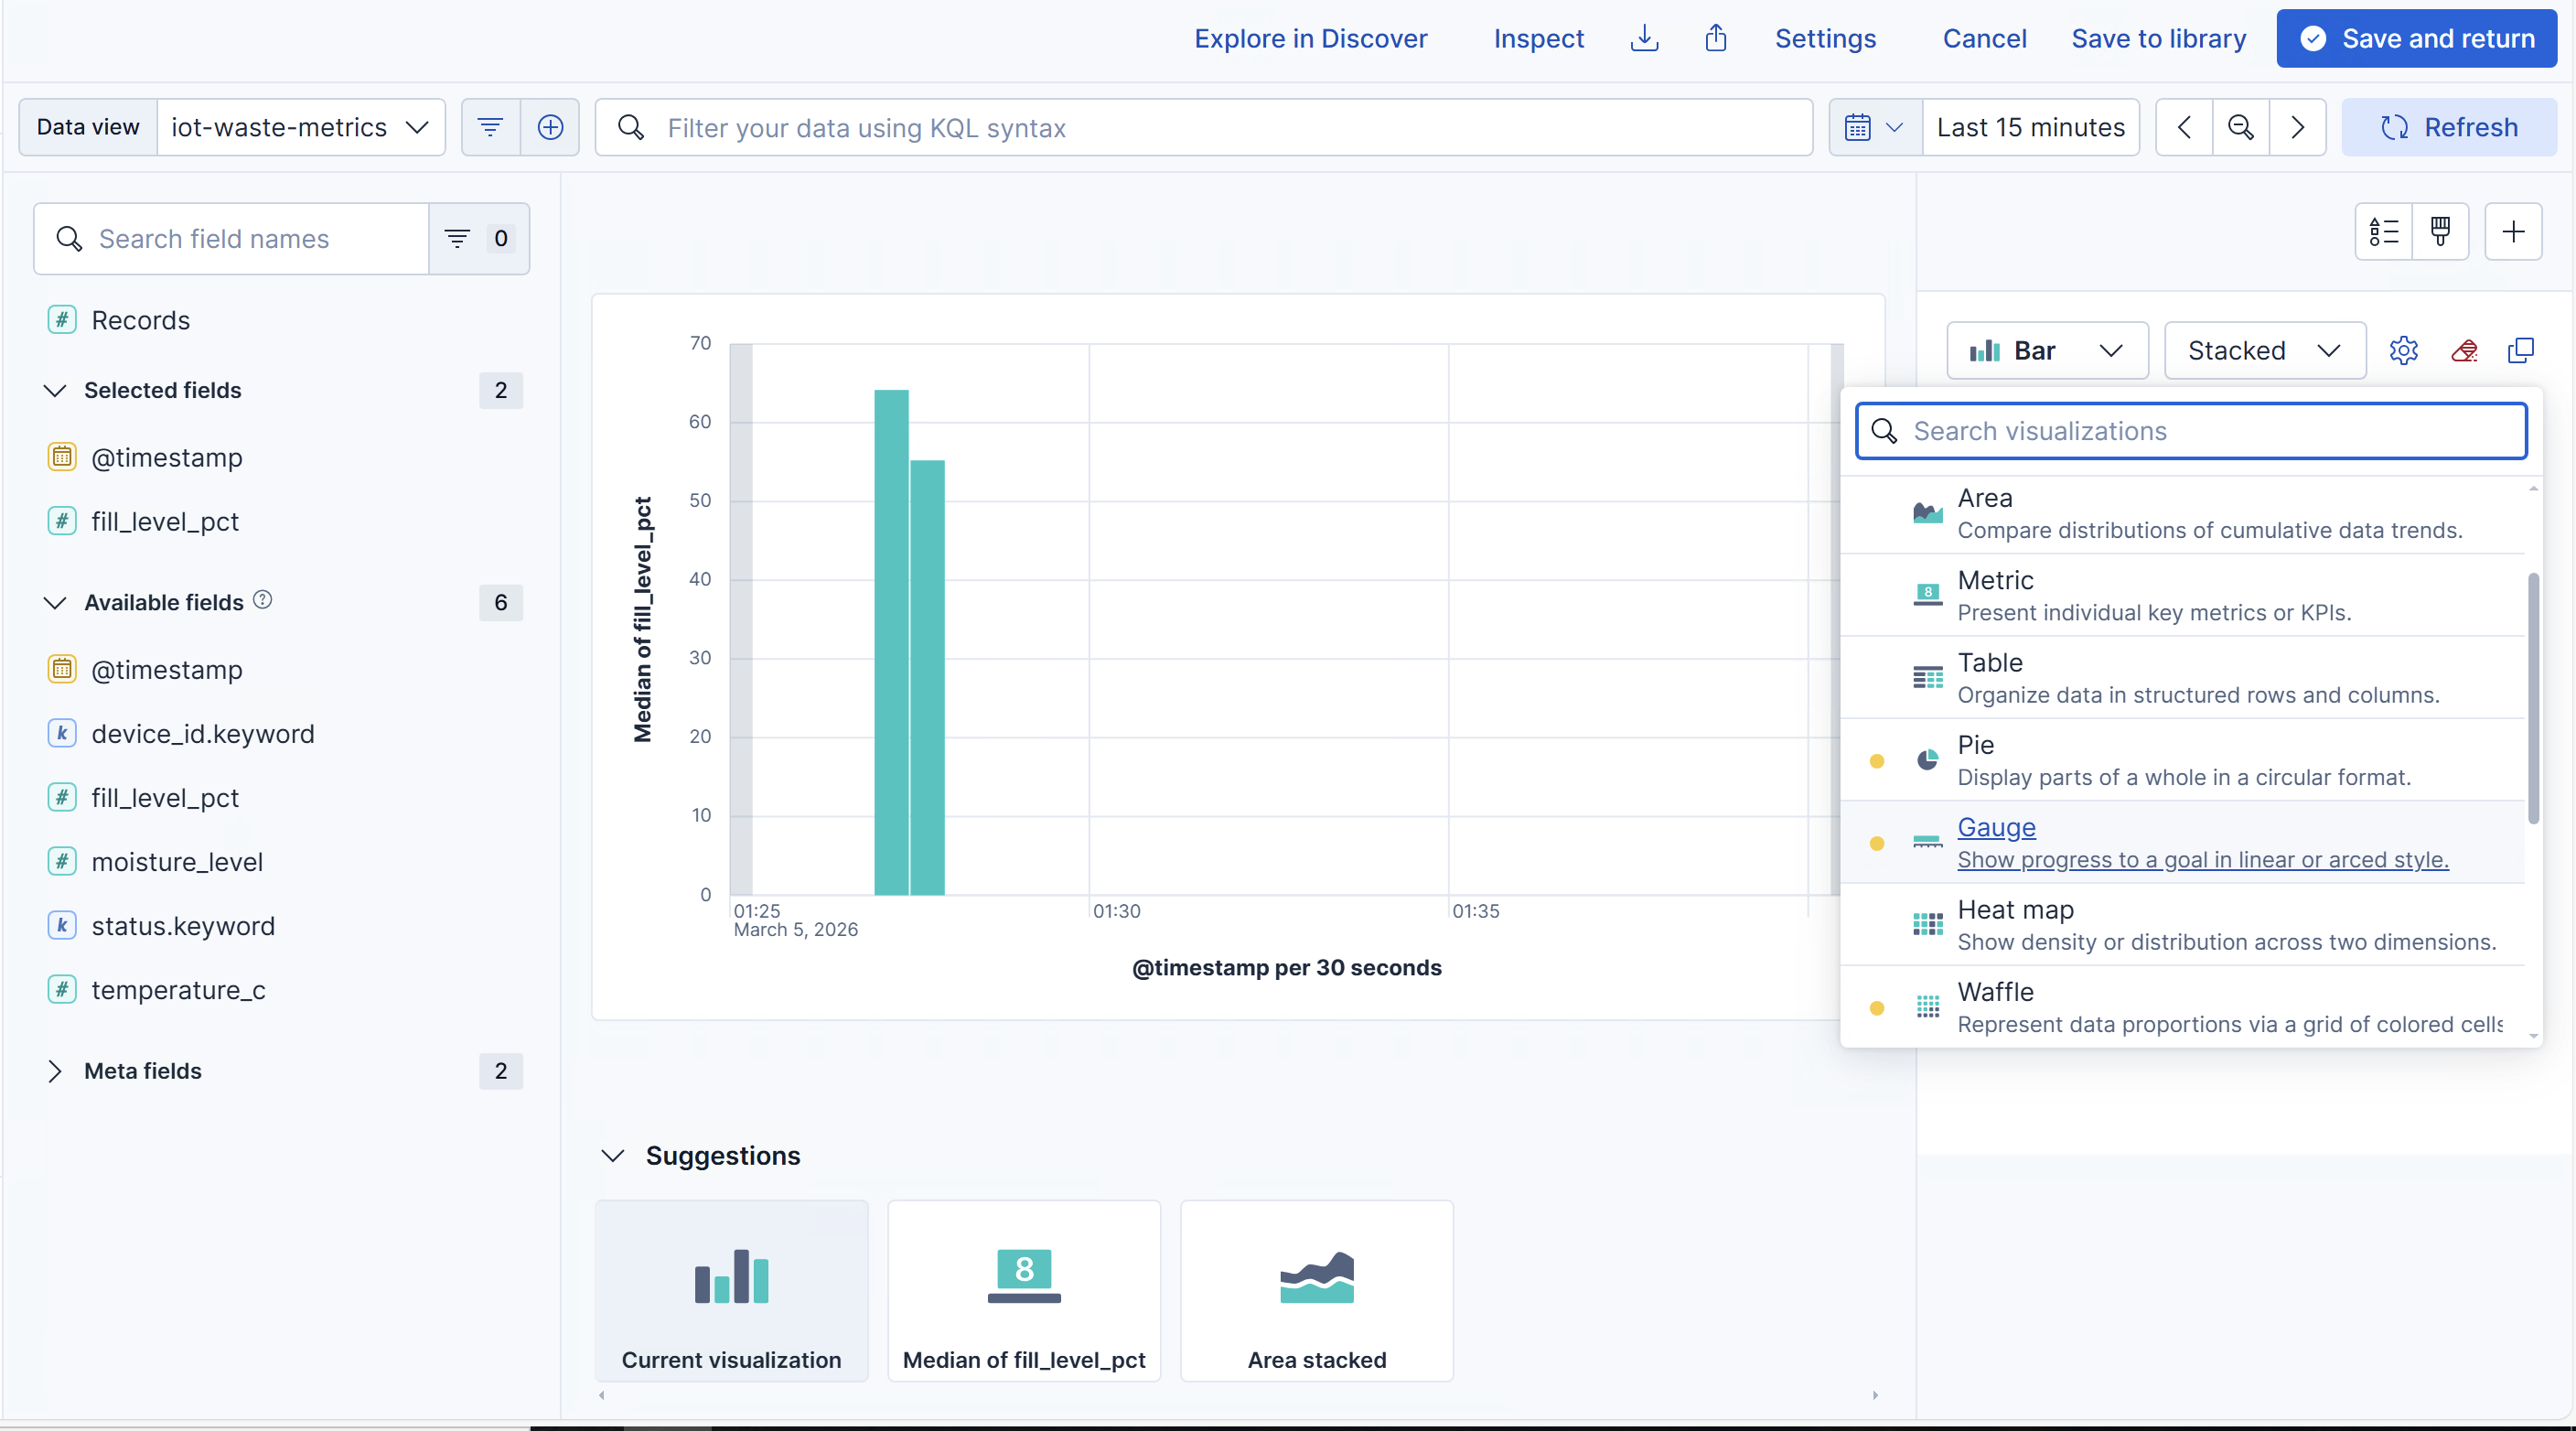
On the right side, we pick Gauge and choose the data aggregation method Median, Average , Maximum, etc.
We can also see different fill levels for different smart bins, as shown below:
Further Exploration
Using this tool, we can choose machine learning in the left part:
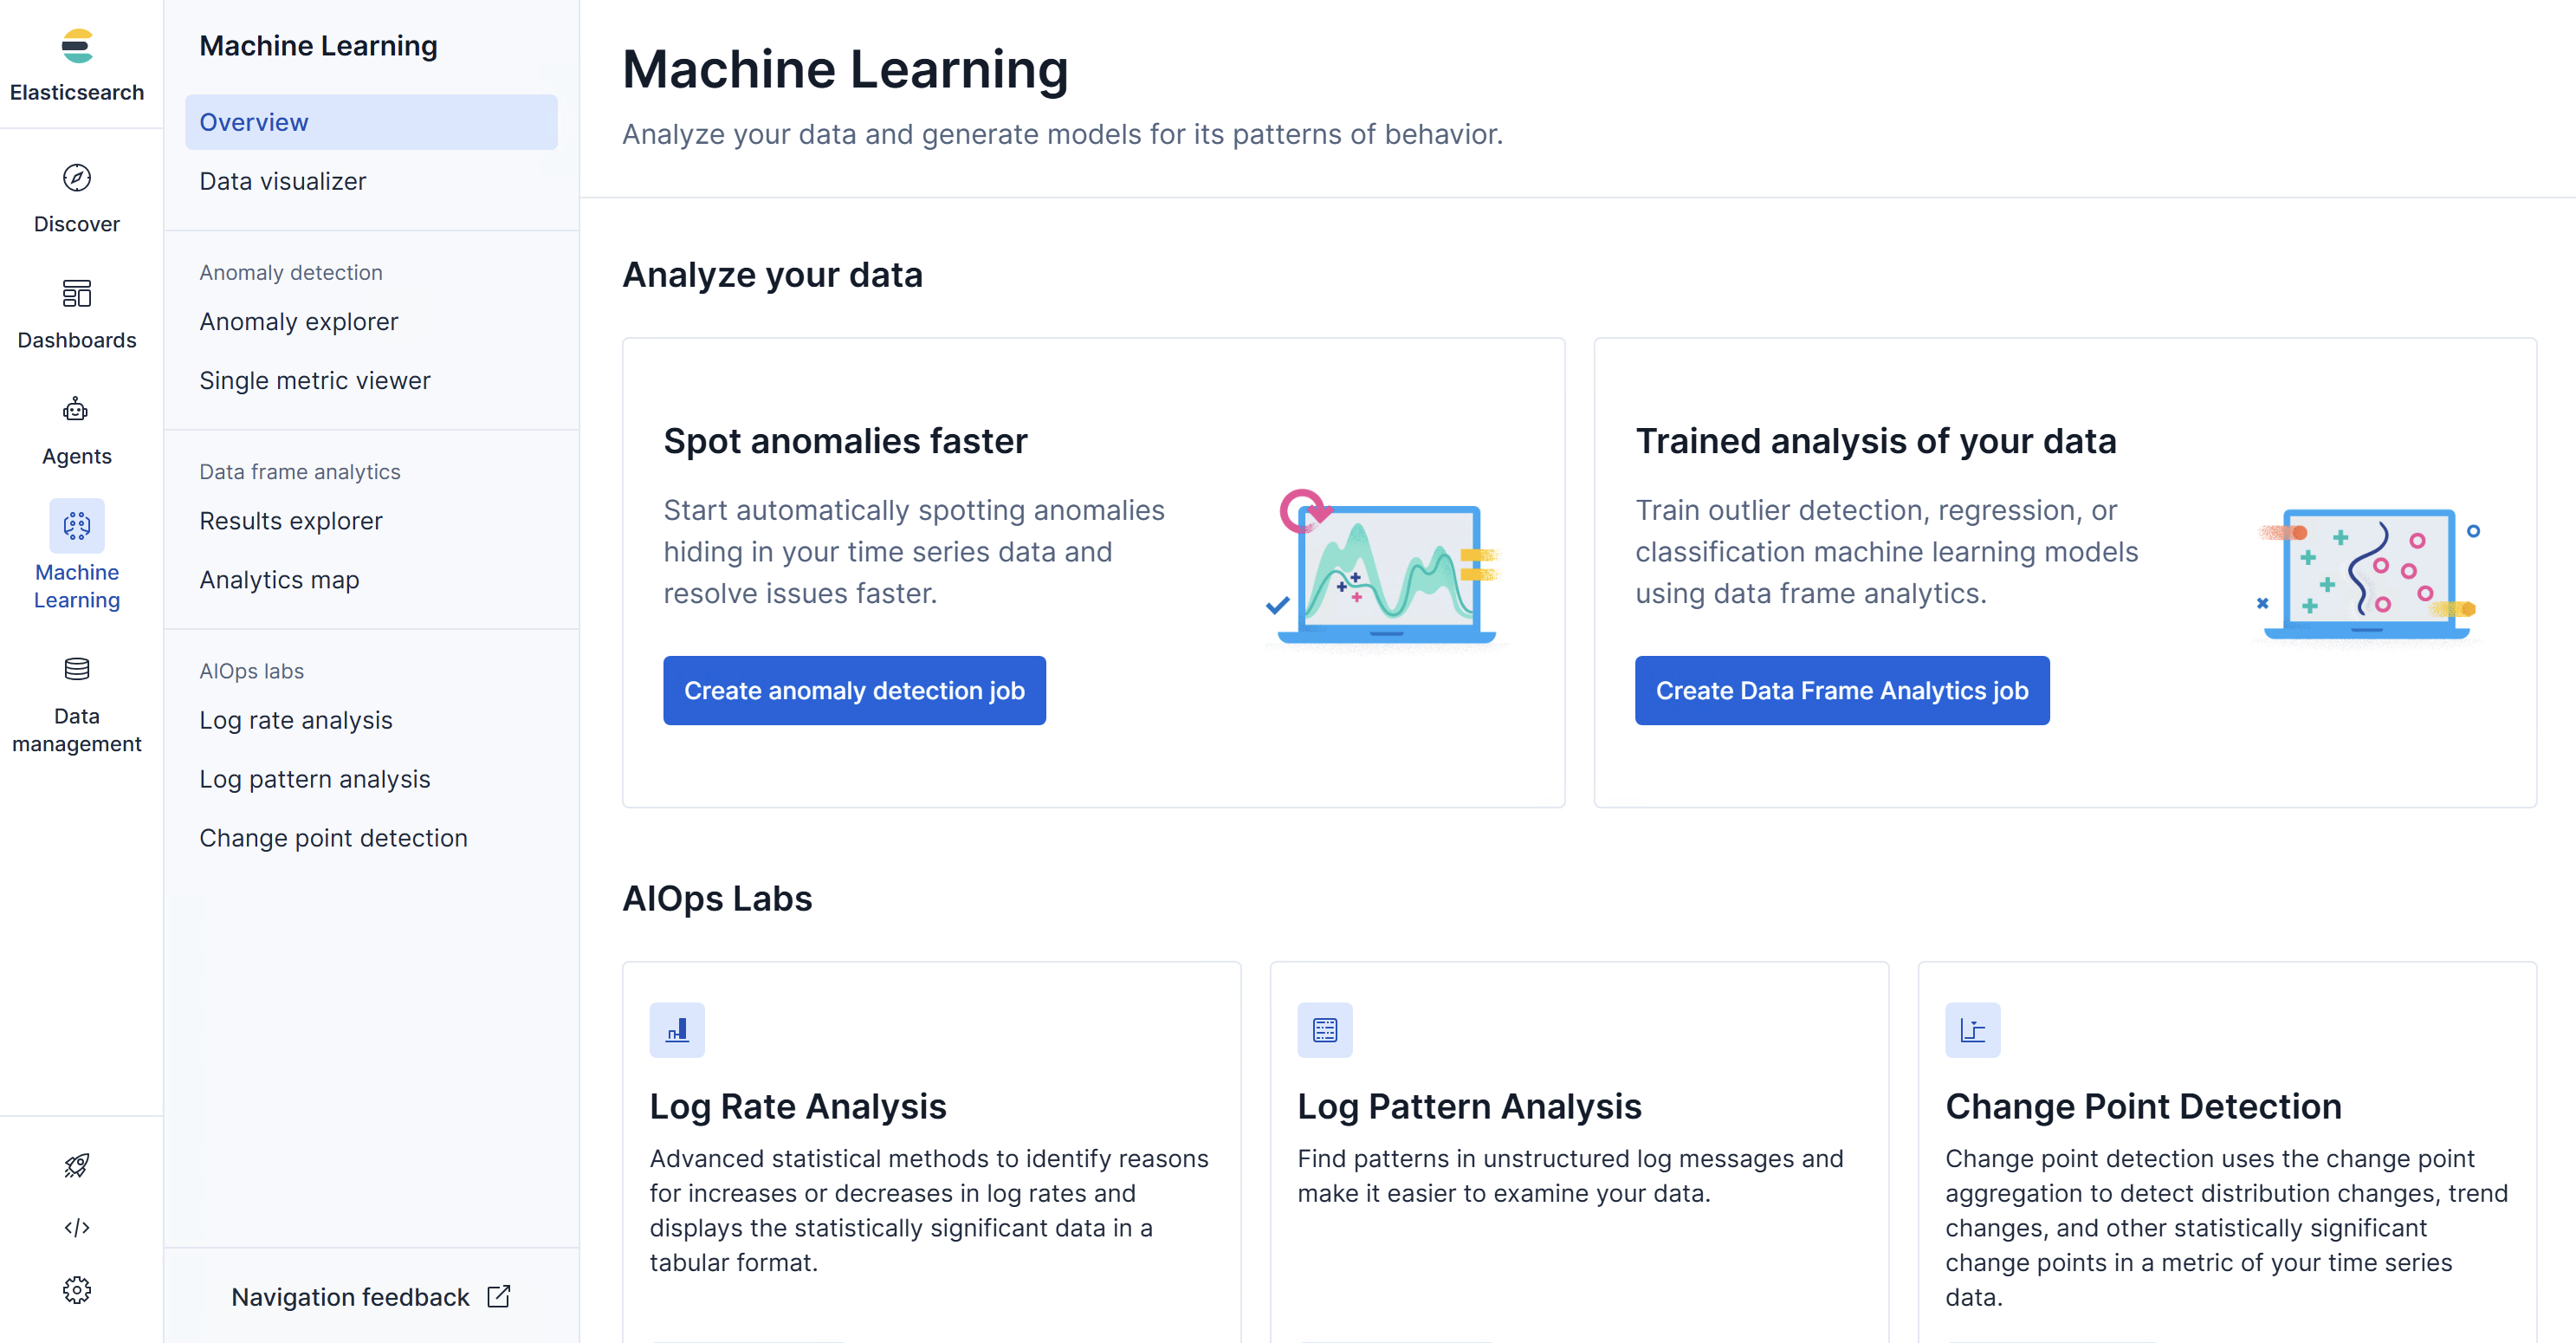
Different functions are provided. Based on this, we can train our customized model.
Also, other Python libraries for machine learning and deep learning are highly encouraged, especially, Pytorch and Tensorflow.
 wechat